How to Use Our Maps
After consulting his trusty map, looks like Ken has found the way to go!
Here's our suggestions for using the maps in our Bundle to guide you through a great bike trip.
After having downloaded & installed the Map Bundle, when you open Avenza Maps on your device, you'll find a home screen that looks like this:
The Home Screen on our iPad Mini
Tap on the folder SCT Bordeaux-Arcachon (our tour) and you'll see the list of maps:
The contents of our Map Bundle for Bordeaux-Arcachon on our iPad Mini. Scroll to see all 29!
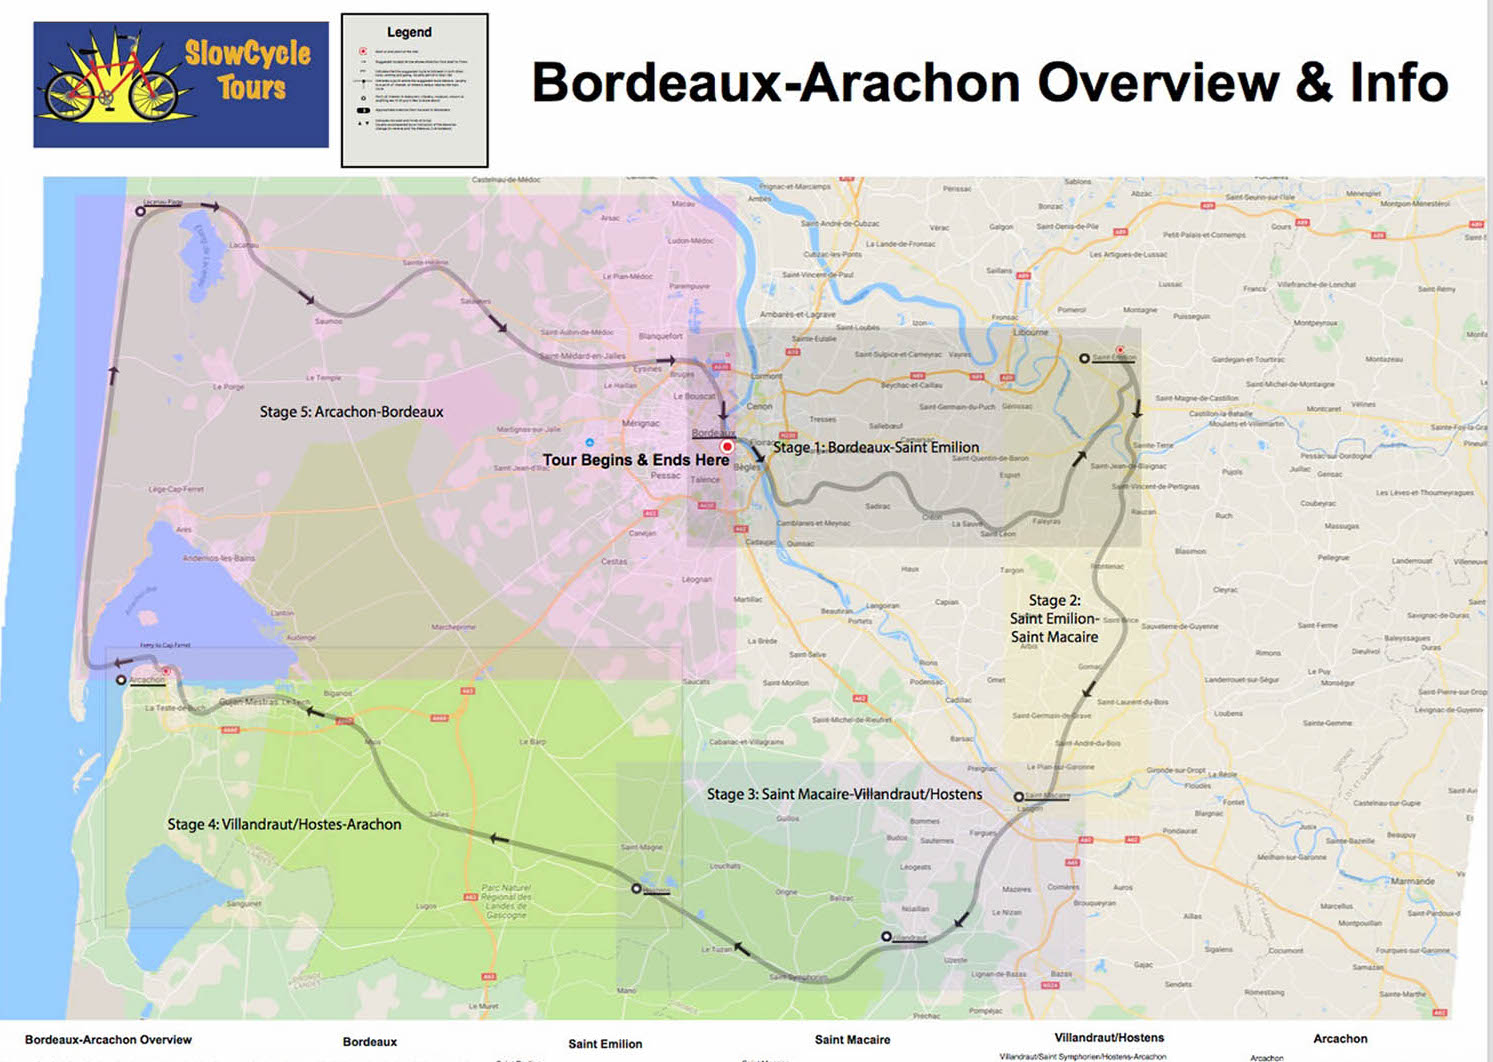
We have several different types of maps, depending on the tour. All the rides have a Overview Map. Here's 00_Bordeaux_Arcachon_Overview that shows the whole tour on one page at very low resolution, so you’ll have a very general idea of where you’re going & the route you’ll follow:
This is the entire Overview Map for our Bordeaux-Arcachon ride. Note that it includes the complete description of the ride with everything you'll need to know. You won't be able to zoom out this far on your tablet or phone. On our iPad Mini, it looks more like this:
This is an Overview map on our iPad Mini, maximum zoom out. Just scroll around to see the everything on the map.
You'll want to view the Overview Map in landscape mode and you'll need to zoom out and scroll around a bit to see the entire map.
These maps also contains a detailed description of each segment of the tour, including the day trips. Everything you need is on the map.
Then there are the route maps of the daily rides themselves, from the starting point to the destination. There are frequently two maps for any given day. So, for this tour, the first day's ride starts out with 02_Bordeaux_Saint Emilion_1. It looks like this:
Again, the complete map for the first part of the route Bordeaux-Saint Emilion. On your device, you'll have to scroll to see the whole map. Here's what this map looks like on our iPad Mini at maximum zoom out:
Zoom in a bit from here, and you'll see this:
This is probably the resolution you'll use most often. You can zoom in more from here if you wish.
The grey translucent line indicates the route that you'll follow. When you're actually in the area covered by the map, the little blue dot will show your position. As always, you'll have to zoom in and out and scroll around to see all the features of the map.
Often we provide detail maps of the city or town you’re leaving from or going to. These maps are generally at a much higher resolution yet, often 1:3000, and they’re designed to help you find the restaurants, hotels, B&Bs, Points of Interest, etc. that we talk about in the ride descriptions. The one for Saint Emilion looks like this:
The complete Saint Emilion Detail map. On your device, you'll need to scroll around to see it all.
Elevation Guides
Each map also contains an Elevation Guide. It looks like this:
The Elevation Guide is a graphical representation of the change in elevation along the route (i.e.; hills). This particular route starts out flat, but has a couple of decent climbs toward the end before leveling out.
The Elevation Guides show the change in elevation along the mapped route. That is, they try to show how how hilly/flat a ride will be. The top graph shows simply the change in elevation along the route, with meters on the Y axis and km along the X axis. It's important to pay attention the scale of the Y axis, otherwise it's easy to be misled. Here the scale on the Y axis is 0-300 meters, but on others the scale could be 0-30. In both cases the graph could look pretty much the same, but needless to say, a change of 10 meters is not the same as a change of 100 meters!
The bottom graph shows the elevation change along the route expressed at % grade, with yellow being pretty much flat. Then, as the grade increases, the color changes from orange to red to green, blue, then purple at pretty substantial grades (like 15-20%). As you know, we avoid hills if we can, but when we can't, we warn you about them.
All maps with a route also have an Elevation Guide, except for a few detail maps where you'll have that information on your route map. Note that for rides that have 2 or more maps, the the Elevation Guide covers the entire ride, not just the section on on the map.


